
The previous post talked about how adopting a new serialization format could give us theoretically an 11x performance improvement. However, I started the post talking about a process that took over 2 days, but only showed improvements from 1hr45m to 9min. Where was the rest of the time spent?
When looking at our processes that took a long time it was easy to pull some metrics from our tooling. AppInsights and NewRelic were able to tell us for example that it was common to see the cost of a write to SQL for a single event to take between 0.3-13ms. Some research showed that Azure Blob storage claims a read rate of 60MB/s. Taking our benchmarks from earlier we found out that we can be spending 180us per event on deserializing JSON payloads.
When talking to the team about how long do we think it is reasonable for us to rebuild a read model from scratch, the common answers were numbers like 10hrs, 1day or 2days. Then when asked considering we had to process say 100 million of our 500 million events for this read model, how long was it reasonable to expect to process a single event? The common responses were values like 1ms, 10ms or 100ms. In isolation these numbers seem reasonable, but under quick analysis, we confirm that humans are typically poor at dealing with very small numbers and very large numbers.
100,000,000 x 100ms = 115 days.
Hmmm…
This is where is becomes apparent that we needed to start applying some engineering practices. So we looked at it from both what we think would be a great goal to aim for, and also looking at current hardware, what are the theoretical limits of what we can achieve?
I/O throughput
I proposed that we should have a goal that a full rebuild of any of our read models should not take longer than 2hrs. This gave us a line in the sand. It also allowed us to figure out how much time we had to spend on each event. If we had 500M events, then our budget was 15us per event, or 70,000 messages per second. They seem like difficult numbers to hit, but we threw it up on the whiteboard.
Next, we looked at what hardware could do for us; a 100Mb network vs Gigabit vs direct access to SSD. I find it unusually common to see development and SysOps teams forgetting that network I/O is measured in bits per second e.g. 100 megabit or 1 gigabit. In contrast mounted drives are measured in bytes per second e.g. 250 megabyte or 550 Megabyte. While hardware crew might whoop about the speed of their gigabit network, a 400MB/s USB stick is 3x faster than it. So if we want to really optimise for speed, we want direct access to a mounted disk, on the metal.
Then I wanted to validate my ageing stats on SSD speeds. My 2yr old laptop had an industry leading SSD when I bought it. That disk can perform reads at about 550MB/s. Recent advances like the Samsung 960 disk had shattered that number. Disks could now do 2,500-3,200MB/s!
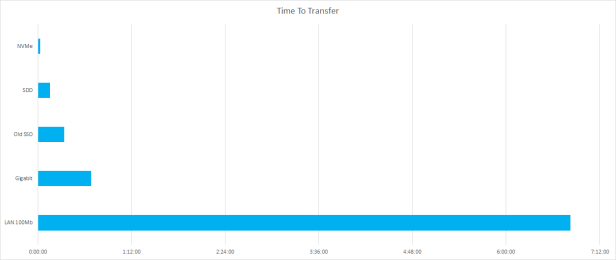
Next, we looked at the old principle of “Do less”. It has worked well for me before. What could we just chop out? We could lean on the huge compression gains we got from adopting lz4 compressed message pack format instead of JSON. That reduced our data size from 3TB to 700GB. However we also identified a whole set of data in our event store that would never be used for read models. This data was effectively from a domain independent to our target read models. We could leverage both this and the immutable nature of an event store to our advantage. We could create a copy, or a cache, of our event store in the new compressed format without the events that we knew would never be relevant. It surprised us, but this further halved our data requirements. In fact, we only needed 300GB of disk to hold all the events for our relevant domains. We now have 10x reduction in I/O! If we were able to get our hands on one of these new NVMe drives like the Samsung 960s, we are now looking at less than 2min to read the entire event cache.
To loop back around, our hybrid event store can hit theoretical download speeds of 60MB/s (480Mbps), but we can do concurrent downloads, but that would max out our gigabit network at 2 concurrent downloads. So to be nice, we can assume 120MB/s throughput speed from our Azure hosted hybrid solution. That is 7h 15min to pull down the whole 3TB set of data. If we ignored the data not relevant to our domain, that still puts us a bit over 3hrs. In comparison, if we happened to have direct access to a fast disk, we could do the read in 2min.
Still, 3hrs to read the data, plus 1h 45min to deserialize doesn’t add up to +2days. Where is all the rest of the time being spent?
Data access patterns
Looking at theoretical numbers is good way to figure out if a product or technology is even in the right ballpark for your needs, but these numbers rarely translate to actual performance in production. When we just consider our download throughput from Azure Blob Storage to pull all of our individual messages, it is unfair to assume we can get sustained 120MB/s downloads. If the event store was stored as buckets or batches in say 100MB files, then these numbers would be reasonable. However we store each message in isolation. As each message is roughly 1-20KB, we are talking about a very significant overhead in retrieving these messages.
If we query our SQL store to get the message address, and receive those in pages of 1,000 that is 500,000 requests to read our 500M events. But then we also need to make 500M HTTP requests to Azure Blob Storage to get the actual data. I think that qualifies as chatty. Considering that this should be reading as fast as possible, we spend a lot of time and resource sending HTTP request headers. If each of these 500,500,000 requests were only 100Bytes we would be uploading over 45GB in HTTP request headers!
We have already identified that we don’t need to read all of the events, so we can reduce from 500M to 90M events to process for our read model in question. This reduced our throughput rate requirement to 12,500 msg/s (or a budget increase to 80us per message). However, even with this reduction in volume, using this chatty protocol would still have us uploading nearly 1GB in HTTP requests for a full rebuild.
After this analysis we considered that we actually want to have a forward-only sequence of events that can be read in a manner sympathetic to its forward-only nature. SQL + Azure, while very capable for many of our requirements, was not ideal for large rebuilds of our read models. It was better suited for large scale random reads, from many clients. What technology could we use to pull sequential data at top speed. We had lots of ideas like Kafka, Rx and Aeron. But we also wanted to keep the stack simple. Installing drivers or more tech was tolerable, but could we get what we wanted without doing so?
So what about storing all the message content in SQL with the headers? We tested this and saw sustained throughput of 4,000 msg/s and peaks at 9,000 msg/s. Pretty cool, but not good enough for our 12,500 messages per second target. Now you could say “get a bigger SQL box”, but there in lies the problem, it was beast of a SQL box that one of the city’s top SQL Server guys had tuned. Throwing more very expensive hardware at the problem wasn’t ideal, nor was it proving to get us the results we wanted.
Then it dawned on us, it was so simple. What is that fastest way to read data from a drive? Read sequentially! So why don’t we just write all our events to a drive in large sequential files? Why put more technology in the way? Again, the old principal of “Do less” seemed to be a good direction.
We created a cache of our event store. Due to the append-only nature of an event store, it is very easy to create a cache. We read from the master source and just append new events to the current file. Our file pattern was simply
- SequenceId : int32 (because this cache would need to grow 4 fold to breach those bounds)
- AggregateTypeId : byte
- AggregateMessageTypeId : byte
- ContentLength : int32
- Content : byte[]
and that pattern repeated until we hit an arbitrary file size of 100MB. Files were named with the initial SequenceId so that we could read them back in the correct order.
This basic design worked very well. Not only was it dead simple to work with (no new software, tools, drivers, libraries), it performed exceptionally well. This design allows us to saturate the disk read throughput of every device we have tried it on.
Combining forces

So then we combined forces:
- “flat file” style cache
- sequential reads
- exclude the non-relevant events from being written to the cache
- Lz4 compressed MessagePack format
- Samsung 960 EVO NVMe drives
This Voltron-like-synergy, collapsed our data space requirements from 3TB to 300GB and more importantly allowed us to test a full read* in under 3 minutes! Read times for a 100MB file were 81ms median and 83ms mean, with a maximum of 195ms.
*Just a read of the data. Zero processing was performed.
