
With the emerging importance of data analytics, the integrity and reliability of data warehouse queries are paramount. These queries are foundational for decision-making processes in many companies. Yet, ensuring their accuracy and performance presents a unique set of challenges. From the nuanced pitfalls of data quality to the complexities of generating test data and ensuring the repeatability of tests, professionals in this field often navigate a maze without a clear map.
Traditionally, the discipline of software engineering has developed robust methodologies for testing, ensuring that applications perform as expected under various conditions. However, the specialised nature of data warehouses, which often require queries that span multiple schemas, where the ownership of these schemas can be from numerous teams, requires a tailored approach to testing. This blog post aims to bridge this gap, drawing upon proven principles from software engineering and adapting them to the unique context of data warehouse queries.
By examining the obstacles inherent in data warehouse testing—such as handling data quality issues, generating representative test data, and achieving test repeatability—we lay the groundwork for a discussion on innovative solutions. These solutions address the challenges and elevate the practice of testing queries in data warehouses to standards accepted elsewhere in the Software community. This post provides a technology-agnostic framework for automated testing that is both rigorous and adaptable, ensuring the reliability of data warehouse queries in an ever-changing data landscape.
Challenges
The Microservices movement encouraged the idea that data should live with the application that owns it. Finding that balance of high cohesion and loose coupling aimed to solve the issue of breaking changes that external dependencies could introduce. Microservices seek to protect internal data stores by abstracting them behind published APIs. These APIs could be independently versioned, allowing changes to a service’s internal implementations without affecting its consumers. External access to a Microservice’s data store is only via published APIs or copies of the data pushed to a data warehouse.
When services are loosely coupled, a change to one service should not require a change to another.”
Sam Newman, Building Microservices: Designing Fine-Grained Systems
In application development, this makes data access testing possible and sometimes even easy, as the development team owns the whole system. Using designs like Ports and Adapters allows domain logic to be tested independently of the data store. This enables data quality tests to focus on the API or Data Layer. For example, comprehensive tests can be written for the Web API input validation. A test suite can also be created to ensure data entered or retrieved from the relational database meets expectations.
This proves to be somewhat of a challenge within the data analytics space. Unlike application development, where a team can control the whole system and environment, a data analyst or even a data engineer often must pull together data from multiple databases or schemas they do not own. In addition to the communication overhead this creates, it also introduces the challenge of being able to create test data. While test data can be made from generated data sets or sanitised copies from production, both methods can prove resource-intensive and fall short of the rigour a systematic test case generation process can provide. Even with Zero Copy Clone features, sourcing copies of Production data can introduce questionable privacy practices, non-repeatable or non-deterministic workflows, and potentially high costs. Navigating a company’s organisational structure and source control systems to discover schema and reference data generation source code will be challenging. Even if you do find the scripts you are looking for, you still need to gain access to them and ensure you can execute them correctly. You have now coupled your development process with another team’s.
The rigour of quality control can also fall short when verification is simply manual UAT or ad hoc spot-checking of reports or query results. While the data industry does have data quality tooling as a subset of the Data Integrity process, it tends to focus heavily on the ETL process. Data Quality tools focus on getting quality data to analysts but lack the controls to ensure that consumers of the analysis are getting the answers they are expecting. This seems akin to only providing unit tests for a Web API input validation but skipping domain logic or integration tests. Ensuring tests can be repeated consistently over time is crucial for validating the ongoing accuracy of queries, especially as data evolves. A query that performs correctly today must be tested against future data to ensure it remains valid. This challenge is compounded when tests depend on constantly changing data or when tests need to be rerun in response to updates in business logic or reporting requirements. When testing is manual or ad hoc, we are limiting the likelihood of these tests being repeated wholly or accurately.
Data Quality tools focus on getting quality data to analysts but lack the controls to ensure that consumers of the analysis are getting the answers they are expecting.
Lee Campbell

By addressing these challenges head-on, we can lay a solid foundation for implementing robust, automated testing strategies for data warehouse queries, ensuring that data-driven decisions are based on reliable and accurate information.
Principles
If we take the principles from adjacent disciplines in information technology, I believe we can overcome the challenges listed above. Adopting the following principles of
- segregation of responsibilities,
- isolation of dependencies,
- specification-based testing, and
- automated testing
will allow us to overcome these challenges with a reproducible pattern that works across data warehouse technologies and testing tools.
By segregating our business logic from input and output processing, we can increase the clarity of the solution domain and provide opportunities to test independently. Like in the Web API example, we would segregate our HTTP handling and input validation from our core domain logic. We can follow this pattern by isolating our ETL/ELT code from our reporting queries. This pattern is commonly adopted in the Data Engineering and Data Analytics space. A failure of this segregation may be seen if a query must transform, deduplicate or cleanse data in addition to the logic required for the report.
By isolating our dependencies, application developers have been able to test parts of a system independently. While segregating components is one step, if they all have direct dependencies on each other, they are tightly coupled and still need to be tested as a single unit. For example, when a query directly references a table, then the table needs to be included in any testing of that query. Instead, by defining an interface that the query can use as a layer of indirection, the query can be tested independently of the underlying table. Views offer a way to achieve this abstraction in relational databases and most data warehouses.
Most queries and reports data analysts produce seem to extend past the simple and live closer to the complicated end of the spectrum. They must often consider data selection, connection, clarity, and aggregation.
- Selection – The data that must be included and excluded. This may consider reporting time ranges, regulatory exclusions, and internal exclusions like staff purchases.
- Connection – Joining data to other data sets. Often using primary keys, but may require temporal range matching, string matching or other.
- Clarity – The semantic meaning of data is critical. Should a purchase be counted once the payment is taken, once the payment has settled, or once the product has been delivered and the return window has closed? Is the amount in USD or EUR? Is it inclusive or exclusive of taxes?
- Aggregation – The data may need to be grouped by time, customer, department, etc. Should exclusion happen before or after aggregation? Are minimums, means or maximums appropriate? Should it be a count or the 99th percentile? Should the report show multiple aggregations and compare them over time, e.g. p90, p99, p99.9 by day for the last month?
We can look to the ISTQB for guidance on testing based on a system’s inputs and outputs. This style is called black-box testing, behavioural-based testing, or specification-based testing. It directs us to consider:
By leveraging these four concepts, we can see that we can support the four considerations (Selection, Connection, Clarity & Aggregation) a data analyst has. These techniques allow us to apply rigour to our test cases that we may not find with ad hoc manual testing. Equivalence partitioning will help us identify test cases where data must be included and excluded. Boundary testing will help us assert that our aggregations and connections are correct. Using boundary testing to understand the state transitions in our data can also assert our semantic understanding of the data. Finally, decision table testing (or Approval Testing) can help us communicate how inputs will result in outputs with SMEs.
Solution Pattern
We can use the tools above to craft a generalised solution that will work across many data warehouse technologies. Our first technique will be equivalence partitioning and boundary testing to create a set of Approval Tests. We will then introduce a method for isolating our dependencies. Lastly, we will adopt a pattern allowing data substitution while testing in an automated environment.
Generating Tests
Without being overly prescriptive in how you generate your tests, there are benefits of using existing techniques to create broad test coverage, ensuring the correct behaviour of a system. We can create a systematic method for producing test cases with appropriate data coverage and maintaining a proportional response to risk by looking at concepts like equivalence partitioning and boundary value analysis.
Using an example of a monthly purchase report, we can look at how we could drive out test cases:
- Months start at 00:00:00z of the 1st of the month and do not overlap.
- Purchases are to be included when they are settled (i.e. not submitted or accepted).
- Any purchases that are subsequently returned, cancelled, or refunded contribute to negative cash flow at the point they are executed, not when the purchase was made.
This helps us create a table of tests to consider for a Jan 2000 monthly report.
| Partition | Boundary | Validity |
| Date | 1999-12-31T23:59:59z | Excluded |
| Date | 2000-01-01T00:00:00z | Included |
| Date | 2000-01-31T23:59:59z | Included |
| Date | 2000-02-01T00:00:00z | Excluded |
| Purchase Status (+ve flow) | Submitted | Excluded |
| Purchase Status (+ve flow) | Accepted | Excluded |
| Purchase Status (+ve flow) | Settled | Included |
| Purchase Status (+ve flow) | Cancelled | Excluded |
| Purchase Status (-ve flow) | Submitted | Excluded |
| Purchase Status (-ve flow) | Accepted | Excluded |
| Purchase Status (-ve flow) | Settled | Excluded |
| Purchase Status (-ve flow) | Cancelled | Included |
| Refund Status (-ve flow) | Submitted | Excluded |
| Refund Status (-ve flow) | Refunded | Included |
| Refund Status (-ve flow) | Returned | Included |
| Refund Status (-ve flow) | Cancelled | Excluded |
Approval Tests
Equivalence partitioning and boundary value analysis are great for helping us understand what needs to be covered. It still leaves a gap in how we utilise this in practice for our testing. Approval Testing take the concept of Decision Table testing and elevate it to specifying expected outcomes, in our case, as a table.
We can use the test cases generated above to create an input dataset. This data set should provide data that asserts our boundary testing.
Purchase data set
First, I create a data set using my first combination of boundary conditions. I will start with four rows with the initial date boundary condition of “Updated at 1999-12-31 T23:59:59z”, with a row for each status value.
| Purchase Id | Account id | Created at | Amount | Status | Updated At |
| 1 | 1 | 1999-12-31 T23:59:59z | 100 | Submitted | 1999-12-31 T23:59:59z |
| 2 | 1 | 1999-12-31 T23:59:59z | 101 | Accepted | 1999-12-31 T23:59:59z |
| 3 | 1 | 1999-12-31 T23:59:59z | 102 | Settled | 1999-12-31 T23:59:59z |
| 4 | 1 | 1999-12-31 T23:59:59z | 103 | Cancelled | 1999-12-31 T23:59:59z |
While this data all lands in our “invalid equivalence partition”, it should still produce a report with a row. That row should have zero for both cashflows.
| Month | Cash in | Cash-out |
| Jan 2000 | 0 | 0 |
We now complete the input data set as such:
| Purchase Id | Account id | Created at | Amount | Status | Updated At |
| 1 | 1 | 1999-12-31 T23:59:59z | 100 | Submitted | 1999-12-31 T23:59:59z |
| 2 | 1 | 1999-12-31 T23:59:59z | 101 | Accepted | 1999-12-31 T23:59:59z |
| 3 | 1 | 1999-12-31 T23:59:59z | 102 | Settled | 1999-12-31 T23:59:59z |
| 4 | 1 | 1999-12-31 T23:59:59z | 103 | Cancelled | 1999-12-31 T23:59:59z |
| 5 | 1 | 1999-12-31 T23:59:59z | 104 | Submitted | 2000-01-01 T00:00:00z |
| 6 | 1 | 1999-12-31 T23:59:59z | 105 | Accepted | 2000-01-01 T00:00:00z |
| 7 | 1 | 1999-12-31 T23:59:59z | 106 | Settled | 2000-01-01 T00:00:00z |
| 8 | 1 | 1999-12-31 T23:59:59z | 107 | Cancelled | 2000-01-01 T00:00:00z |
| 9 | 1 | 2000-01-01 T00:00:00z | 108 | Submitted | 2000-01-01 T00:00:00z |
| 10 | 1 | 2000-01-01 T00:00:00z | 109 | Accepted | 2000-01-01 T00:00:00z |
| 11 | 1 | 2000-01-01 T00:00:00z | 110 | Settled | 2000-01-01 T00:00:00z |
| 12 | 1 | 2000-01-01 T00:00:00z | 111 | Cancelled | 2000-01-01 T00:00:00z |
| 13 | 1 | 2000-01-31 T23:59:59z | 112 | Submitted | 2000-01-31 T23:59:59z |
| 14 | 1 | 2000-01-31 T23:59:59z | 113 | Accepted | 2000-01-31 T23:59:59z |
| 15 | 1 | 2000-01-31 T23:59:59z | 114 | Settled | 2000-01-31 T23:59:59z |
| 16 | 1 | 2000-01-31 T23:59:59z | 115 | Cancelled | 2000-01-31 T23:59:59z |
| 17 | 1 | 2000-01-31 T23:59:59z | 116 | Submitted | 2000-02-01 T00:00:00z |
| 18 | 1 | 2000-01-31 T23:59:59z | 117 | Accepted | 2000-02-01 T00:00:00z |
| 19 | 1 | 2000-01-31 T23:59:59z | 118 | Settled | 2000-02-01 T00:00:00z |
| 20 | 1 | 2000-01-31 T23:59:59z | 119 | Cancelled | 2000-02-01 T00:00:00z |
If we reduce this data set down to rows that meet the criteria (values in bold above), we can start to reason about the expected output.
| Purchase Id | Account id | Created at | Amount | Status | Updated at |
| 7 | 1 | 1999-12-31 T23:59:59z | 106 | Settled | 2000-01-01 T00:00:00z |
| 8 | 1 | 1999-12-31 T23:59:59z | 107 | Cancelled | 2000-01-01 T00:00:00z |
| 11 | 1 | 2000-01-01 T00:00:00z | 110 | Settled | 2000-01-01 T00:00:00z |
| 12 | 1 | 2000-01-01 T00:00:00z | 111 | Cancelled | 2000-01-01 T00:00:00z |
| 15 | 1 | 2000-01-31 T23:59:59z | 114 | Settled | 2000-01-31 T23:59:59z |
| 16 | 1 | 2000-01-31 T23:59:59z | 115 | Cancelled | 2000-01-31 T23:59:59z |
With three settled purchases contributing to Cash in-flows, we have 106+110+114 =330.
With two cancelled purchases contributing to Cash out-flows, we have 111+115 =226.
Note that we are ignoring the Created at column. It is the Updated at column we are using for our filter. We will expect the output for the January 2000 report to be as follows:
| Month | Cash-in | Cash-out |
| Jan 2000 | 330 | 226 |
Refund data set
We can then repeat the exercise with refund data sets.
| Refund Id | Account id | Created at | Amount | Status | Updated At |
| 1 | 1 | 1999-12-31 T23:59:59z | 10 | Submitted | 1999-12-31 T23:59:59z |
| 2 | 1 | 1999-12-31 T23:59:59z | 11 | Refunded | 1999-12-31 T23:59:59z |
| 3 | 1 | 1999-12-31 T23:59:59z | 12 | Returned | 1999-12-31 T23:59:59z |
| 4 | 1 | 1999-12-31 T23:59:59z | 13 | Cancelled | 1999-12-31 T23:59:59z |
| 5 | 1 | 1999-12-31 T23:59:59z | 14 | Submitted | 2000-01-01 T00:00:00z |
| 6 | 1 | 1999-12-31 T23:59:59z | 15 | Refunded | 2000-01-01 T00:00:00z |
| 7 | 1 | 1999-12-31 T23:59:59z | 16 | Returned | 2000-01-01 T00:00:00z |
| 8 | 1 | 1999-12-31 T23:59:59z | 17 | Cancelled | 2000-01-01 T00:00:00z |
| 9 | 1 | 2000-01-01 T00:00:00z | 18 | Submitted | 2000-01-01 T00:00:00z |
| 10 | 1 | 2000-01-01 T00:00:00z | 19 | Refunded | 2000-01-01 T00:00:00z |
| 11 | 1 | 2000-01-01 T00:00:00z | 20 | Returned | 2000-01-01 T00:00:00z |
| 12 | 1 | 2000-01-01 T00:00:00z | 21 | Cancelled | 2000-01-01 T00:00:00z |
| 13 | 1 | 2000-01-31 T23:59:59z | 22 | Submitted | 2000-01-31 T23:59:59z |
| 14 | 1 | 2000-01-31 T23:59:59z | 23 | Refunded | 2000-01-31 T23:59:59z |
| 15 | 1 | 2000-01-31 T23:59:59z | 24 | Returned | 2000-01-31 T23:59:59z |
| 16 | 1 | 2000-01-31 T23:59:59z | 25 | Cancelled | 2000-01-31 T23:59:59z |
| 17 | 1 | 2000-01-31 T23:59:59z | 26 | Submitted | 2000-02-01 T00:00:00z |
| 18 | 1 | 2000-01-31 T23:59:59z | 27 | Refunded | 2000-02-01 T00:00:00z |
| 19 | 1 | 2000-01-31 T23:59:59z | 28 | Returned | 2000-02-01 T00:00:00z |
| 20 | 1 | 2000-01-31 T23:59:59z | 29 | Cancelled | 2000-02-01 T00:00:00z |
Reduced to:
| Refund Id | Account id | Created at | Amount | Status | Updated At |
| 6 | 1 | 1999-12-31 T23:59:59z | 15 | Refunded | 2000-01-01 T00:00:00z |
| 7 | 1 | 1999-12-31 T23:59:59z | 16 | Returned | 2000-01-01 T00:00:00z |
| 10 | 1 | 2000-01-01 T00:00:00z | 19 | Refunded | 2000-01-01 T00:00:00z |
| 11 | 1 | 2000-01-01 T00:00:00z | 20 | Returned | 2000-01-01 T00:00:00z |
| 14 | 1 | 2000-01-31 T23:59:59z | 23 | Refunded | 2000-01-31 T23:59:59z |
| 15 | 1 | 2000-01-31 T23:59:59z | 24 | Returned | 2000-01-31 T23:59:59z |
With six refunds contributing to Cash out-flows, we have 15+16+19+20+23+24 = 117. When added to the value of 226 for cancelled purchases, we have a total cash-out value of 343. You may notice I have created the data set with each row having unique values for the amount. This is not required. However, it should make it easier for me to identify which data corrupts my results when my tests fail.
With refund data contributing, we will expect the output for the January 2000 report to be as follows:
| Month | Cash-in | Cash-out |
| Jan 2000 | 330 | 343 |
It is worth noting that we have two input table data sets here. However, we have uncovered at least four ways of using them.
- Both data sets are empty. This should still result in a report with a single row; the cash flow values are zero,
- purchases data,
- refunds data,
- both purchase and refund data.
Both input and output data sets are simple to understand and in an accessible format, i.e. human-readable. This allows us to have an SME verify that our assumptions of this report are correct before writing a line of code.
Ports and Adapters in a Data Warehouse
A unique challenge that Data Warehouses introduce is that queries often span multiple schemas that do not belong to the query’s author. This lack of ownership reduces the ability to manipulate data for testing. As David Wheeler is famously quoted :
All problems in computer science can be solved by another level of indirection.
David Wheeler
Considering indirection as a tool, we can take a concept from the software engineering industry of Hexagonal Architecture (or Onion Architecture or Clean Architecture) to create a layer of abstraction that we can own and utilise to help with testing.
Suppose we use our examples of purchases and refunds from above. In that case, we may find that we are writing our queries in the presentation layer with curated data from the published layer in our data warehouse. While the layering or scoping terminology will likely differ in your data warehouse, generally, I see there are multiple layers, either logical or physical:
- Source data – “raw”, “landing” or “bronze”
- Internal data – “staging”, “cleansed” or “silver”
- Published data – “modelling”, “curated” or “gold”
- Presentation layer – Reporting
These layers support our desire for segregation of responsibilities. Our queries against the Published data should not be concerned with de-duplication, translation, or cleansing performed in the layers below. However, unlike in contemporary application software design, which will interact against abstractions, our queries often interact directly with our dependencies, i.e. the Published data owned by another team.
USE Marketing;
SELECT MONTH, CASH-IN, CASH-OUT FROM Sales.Published.Purchases;
This direct dependency that the Marketing team is taking on the Sales team’s data makes it challenging to substitute data for testing.

One could consider using SQL templates with token replacement to point to substituted data sets. However, this may create a sub-optimal development experience as IDE will not understand the SQL query with tokens.
USE Marketing;
SELECT MONTH, CASH-IN, CASH-OUT FROM {Sales_Published}.Purchases;
This technique also requires some automated token replacement step at build or deploy time. We will use another method instead.
Creating a layer of abstraction can open the door for a better testing experience. Instead of directly referencing the Published schema in the Sales Database, we can define an abstraction within our domain of Marketing. We can lean on views defined in our database and schema to provide that abstraction layer. In application development, software engineers will use layers of abstraction to create a “seam” where they can substitute the implementation behind the abstraction.
A seam is a place where you can alter behaviour in your program without editing in that place.
Michael Feathers
We can do the same thing with our views.
USE Marketing;
CREATE VIEW Marketing.Internal.vw_Purchases
AS
SELECT Amount, Status, Updated_at
FROM Sales.Published.Purchases;
The query can now be updated to use our new abstraction.
USE Marketing;
SELECT MONTH, CASH-IN, CASH-OUT FROM Marketing.Internal.vw_Purchases;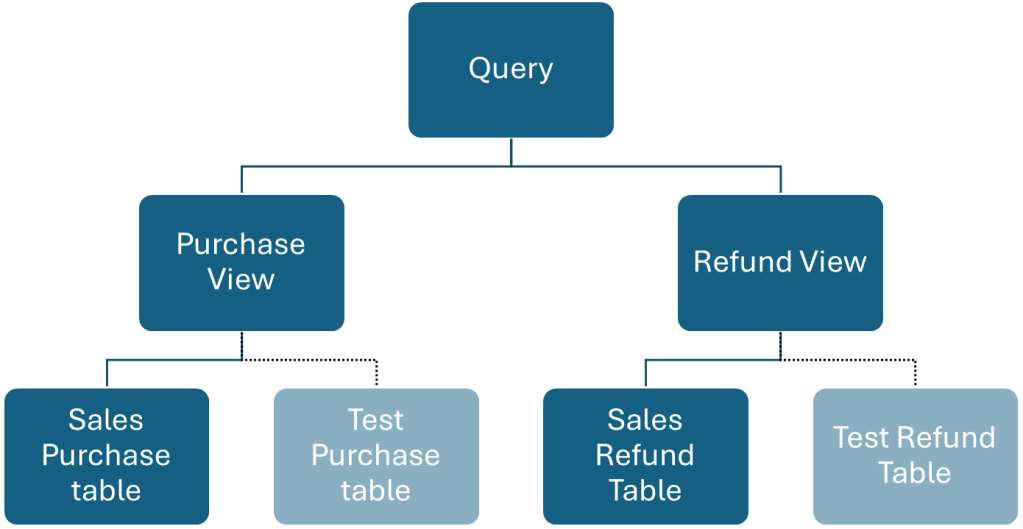
The change we have made here should meet these requirements:
- Dependencies are abstracted. The query we are building no longer directly depends on dependencies we do not own.
- Abstractions are locally defined. The abstractions are tightly coupled to our implementation, so they belong together.
- Abstractions only expose what they need. This minimised unnecessary breaking changes.
- Abstractions are hidden.These abstractions are not for public consumption. They are an internal tool used to optimise for a robust development experience.
At this point, we have aligned to principles of “segregation of responsibilities”, “isolation of dependencies”, and “specification-based testing”, but we are yet to see much of the benefits of doing this. These principles aim to build an environment that enables clarity of code, resilience to changes from upstream changes and assurance that our queries meet the requirements with a proportional response to the risk of inaccuracies.
However, we are left with the critical part that fails to be met in many data warehouses: how do we test this? By testing, I mean testing the query. I don’t mean data validation at the ETL/ELT process. I assume this has already been done. I also don’t mean the data quality checks that run on the published data sets that assert data is in the correct format, the expected range of values, and meets the timeliness expectations. With the assumption that the underlying data is valid, how do I assert with high confidence that my query is accurate when I deploy it and remains accurate if the published data set changes?
Automated Repeatable Tests
Given our Approval Tests that provide input data sets and expected output data sets for a given function (query), we can look to automate the execution and assertion of these tests. A key mechanism to support this will be substituting the production data set for our test data sets. The local views above provide a seam where we can substitute input data sets.
If we create a local table with our test input data, we can replace our abstraction (view) with an equivalent view that exposes data from that test table.
USE Marketing;
CREATE OR REPLACE TABLE Marketing.Internal.Test_Purchases (
  Amount      DECIMAL(38,2),
  Status      VARCHAR(50),
  Updated_at  TIMESTAMP
);
CREATE OR REPLACE VIEW Marketing.Internal.vw_Purchases
AS
SELECT Amount, Status, Updated_at
--FROM Sales.Published.Purchases;
FROM Marketing.Internal.Test_Purchases;

How do we use this technique for testing but not negatively affect the Production environment? We don’t want any production queries using the test purchase table. While we can look to application development practices like unit testing and build servers as part of a CI/CD pipeline, data warehouses often introduce the challenge of a single shared installation. Application developers can run local database installations, and recently, it has become common to use either in-memory emulations of a database or an ephemeral docker instance of a database. This is impractical using cloud-native data warehouse solutions dominating the marketplace. You will likely have to access a shared single-instance system when working with a cloud-native Data Warehouse. Potentially, there is a pre-production and production instance, but generally, both will be shared across the whole company. We must find a way to substitute our abstractions with test data safely.
While the goal of this post is to remain technology agnostic, the following examples demonstrate a pattern that can be implemented in various tools or languages.
Solution Implementation
To make this implementation broadly available, I will demonstrate an implementation using Docker to host a PostgresSQL database server. This will prevent the reader from requiring access to Snowflake, DataBricks, Redshift, BigQuery or another cloud-native Data Warehouse. The example only uses schema segregation, but the principles still stand.
The example environment has the following structure:
central_publisedschema – Schema that defines centrally owned and broadly used definitions.dim_datetable – A dimensionally modelled date table for consistency to be used across the business.
sales_publishedschema – Schema that defines the published sales data sets.purchasetable – All purchase data.
refundtable – All refund data.
marketing_internalschema – Schema that defines objects and data sets that are not published and are for usage only by the marketing team.vw_dateview – Internal abstraction to provide access to date data sets.vw_purchaseview – Internal abstraction to provide access to purchase data sets.vw_refundview – Internal abstraction to provide access to refund data sets.
When the Docker environment is loaded, a SQL migration tool (Flyway) creates each of the schemas above, loading data where required. This environment is now a good emulation for a production data warehouse for our testing purposes.
I am using Kotlin to test our query. This language can be replaced with Python, C# or another language that suits you, as the patterns will work regardless. I create a set of tests that follow a typical execution plan of:
- Create test tables in marketing_internal schema.
- Substitute the implementations of the internal marketing views to use the test tables.
- Execute a scenario-specific Approval Test.
- Reinstate the production implementations of the internal marketing views.
- Drop the test tables.
I only test 4 different scenarios:
- No data,
- Only Purchase data,
- Only Refund data,
- Purchase data and Refund data.
It may seem that you only need to run the last test. However, while writing these tests, I discovered that initially, the query implementation failed the “No data” scenario and the “Only refund data” scenario. We may have forgotten to include the refunds table if we wrote the query without first considering the test scenarios or boundary testing. For example, this query will satisfy the “Only Purchase data” test scenario.
SELECT
    TO_CHAR(updated_at, 'Mon YYYY') as  Month,
    SUM(CASE WHEN status = 'Settled' THEN amount END) as CashIn,
    SUM(CASE WHEN status = 'Cancelled' THEN amount END) as CashOut
FROM
    marketing_internal.vw_Purchase
WHERE
    '2000-01-01' <= updated_at AND updated_at < '2000-02-01'
GROUP BY
    Month;
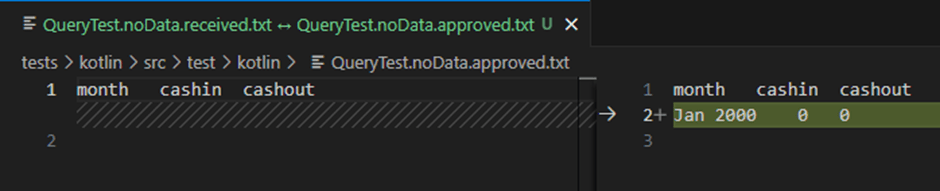
However, this query does not pass any scenario that tests for refunds, as the refund data set is not included in the query. What also becomes clear is that if there is no data, this query does not return any data. It should, however, return a single row for the month with zero values for both cash flows.
The failed tests now act as a guide for me to meet my requirements. I can safely try multiple versions of my query until the tests pass. Once my tests pass, I am also able to lean on other tools like linters, query plans or performance testing tools to improve my query while still having the safety of these tests verifying the accuracy of my query.
I continue building out my query until it passes all my tests. This is what I came up with:
WITH cashflows as(
    SELECT
        updated_at,
        CASE WHEN status = 'Settled' THEN amount END as CashIn,
        CASE WHEN status = 'Cancelled' THEN amount END as CashOut
    FROM
        marketing_internal.vw_Purchase
    UNION ALL
    SELECT
        updated_at,
        0 as CashIn,
        CASE WHEN status IN ('Refunded', 'Returned') THEN amount END as CashOut
    FROM
        marketing_internal.vw_Refund
)

SELECT
    month_name_abbreviated || ' ' || year_actual as Month,
    COALESCE(SUM(CashIn), 0) as CashIn,
    COALESCE(SUM(CashOut), 0) as CashOut
FROM
    marketing_internal.vw_date d
    LEFT OUTER JOIN cashflows c
        ON d.date_actual = c.updated_at::Date
WHERE
   '2000-01-01' <= date_actual AND date_actual < '2000-02-01'
GROUP BY
    Month;
I am sure there are many ways to write this query to satisfy the tests. This is a good thing. It allows us to follow corporate coding standards, apply performance improvements, and add comments while passing these tests. This is a benefit of test-first approaches like specification-based testing.
QueryTest > purchases() PASSED
QueryTest > noData() PASSED
QueryTest > purchasesAndRefunds() PASSED
QueryTest > refunds() PASSED
---------------------------------------------------------------
|  Results: SUCCESS (4 tests, 4 passed, 0 failed, 0 skipped)  |
---------------------------------------------------------------
Using the above patterns, we can ensure that our query meets our requirements through incremental and iterative development. We have a set of repeatable tests that can be executed as part of an automated build pipeline. This allows the data analyst community to enjoy the benefits of fast feedback loops, higher accuracy, early bug detection, and resilience to changes in requirements or dependencies.
For a working example, refer to the public code base at https://github.com/LeeCampbell/testing-sql-queries.
Conclusion
In this post, we showed how to apply the principles of segregation of responsibilities, isolation of dependencies, specification-based testing, and automated testing to querying distributed data sets within a data warehouse. These techniques enabled us to tackle the challenges faced by the data analyst community in terms of distributed data ownership, query accuracy, and resilience to changing models and requirements.
We used a structured approach to generating tests, approval tests to communicate our expectations and the Ports and Adapters pattern to define and isolate our dependencies. With these three techniques in place, we could create repeatable automated tests for our queries.
By leaning on prior art from the Quality Assurance and Software Development communities, we can elevate our Data Analytics industry to meet the demands for integrity and reliability of our business insights.
References
- Clean Code
- Working Effectively with Legacy Code
- The Art of Unit Testing
- Hexagonal Architecture (Ports and Adapters pattern)
- Hexagonal Architecture (explained quite well)
- Onion Architecture
- Specification-based testing
- Equivalence partitioning – Wikipedia & Equivalence partitioning method – Geeks for Geeks
- Boundary-value analysis – Wikipedia & Boundary value analysis – Geeks for Geeks
- Approval Testing & Approval Tests
